Problem
Broadcast win-probability numbers are everywhere, and almost nobody checks them. A model that’s 95% confident in a blowout is easy; the interesting question is whether a 62% in the third quarter is actually 62%.
Approach
- Data. Three seasons of play-by-play (2023–24 through 2025–26), turned into one row per game-state: score differential, time remaining, period, possession, and related signals — 11 features in all.
- Leakage-aware split. Train and validation are split by game, not by row. Splitting by row lets states from the same game land on both sides and quietly inflates every metric.
- Model. A small MLP (11 → 32 → 16 → 1). The model is deliberately small; the effort goes into evaluation.
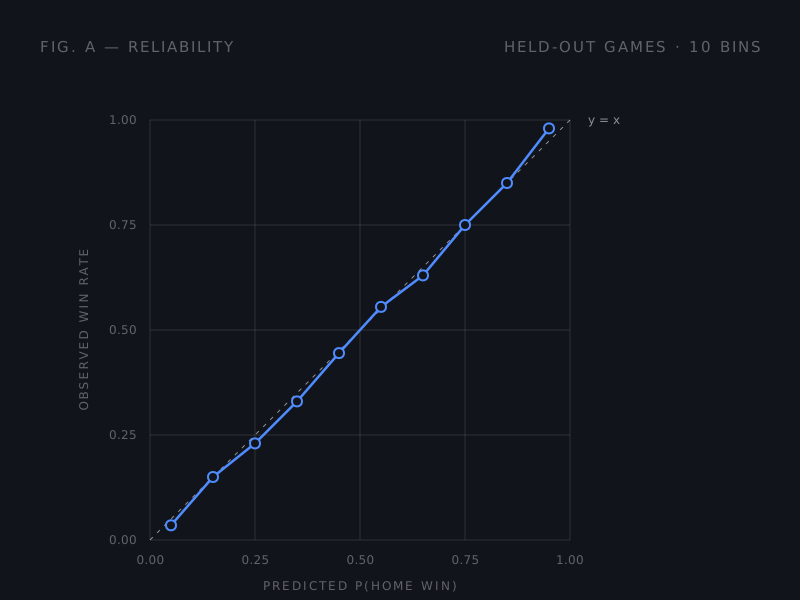
- Calibration. A single temperature parameter is fit on held-out games after training, which fixes overconfidence without changing the ranking of predictions.
Evaluation
Log loss is compared against naive baselines (always pick the home team, always predict the base rate). A 10-bucket reliability diagram checks calibration, and errors are broken down by period and by score differential, so failures in close fourth-quarter games can’t hide inside a good average.
Serving
A Flask-SocketIO server polls the live NBA feed and pushes updated probabilities to the browser over a WebSocket as each possession resolves.